The Blueprint for Private Equity:
Building with the Middle Market
The Blueprint for Private Equity: Building with the Middle Market
Past performance is not necessarily indicative of future results. No assurance can be given that any investment will achieve its given objectives or avoid losses. Unless apparent from context, all statements herein represent GCM Grosvenor’s opinion.
Select risks include: market risk, macroeconomic risk, liquidity risk, interest rate risk, and operational risk.
Takeaways
01.
Vast Market with Supply & Demand Imbalance
The middle market dominates private equity deal flow but remains structurally inefficient, potentially creating outsized opportunities for investors with sourcing depth and relationship-driven access.
02.
Historic Performance Advantage
The middle market offers higher potential returns due to lower entry valuations, reduced competition, and less efficient pricing—attributes that can reward disciplined investors.
03.
Value Creation in a Liquidity-Constrained Market
Middle-market companies offer multiple paths to value creation, from revenue growth and margin improvement to market expansion-often at lower entry multiples with more exit opportunities.
Understanding Middle-Market Private Equity
In an era marked by tighter capital, shifting valuations, and greater scrutiny on portfolio construction, the middle market has emerged as one of private equity’s most resilient and rewarding segments. Unlike mega-cap deals, which are often fully priced and fiercely competitive, the middle market offers structural inefficiencies that can enable investors to buy well, build smartly, and exit opportunistically.
The middle market represents one of the most compelling arbitrage opportunities today, especially for investors equipped with the tools and relationships to navigate it effectively.
Vast Market with Supply & Demand Imbalance
Though it draws less attention than large-cap strategies, the middle market quietly drives the bulk of private equity activity—and offers a deep, dynamic investment landscape. For example, 92% of private companies have between $10 million and $250 million in revenue 1 , while 26% of capital raised in recent years came from funds under $1.5 billion 2
In other words:
- 74% of capital is raised by mega-cap buyout funds
- targeting just 8% of private companies
The middle market, defined as companies with $10 million to $250 million in revenue, is less competitive and offers a much broader universe of opportunities, making supply-demand dynamics more attractive than in the large-cap space.
These numbers are more than statistics—they reflect a broad and dynamic ecosystem where sellers seek liquidity, founders seek partnership, and buyers can often act with more speed and creativity.
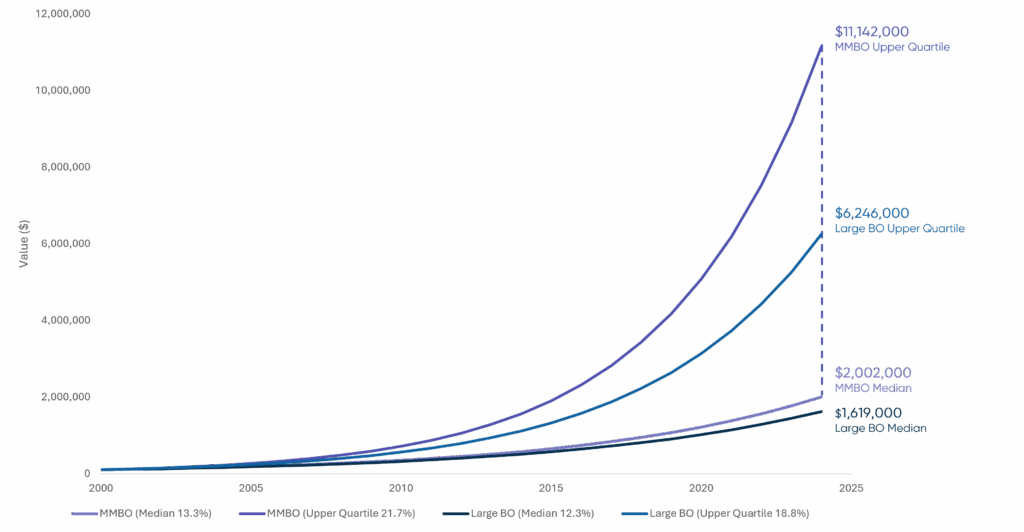
Historic Performance Advantages
As shown in the chart to the right, middle-market private equity has historically delivered higher returns compared to large-cap private strategies, offering a compelling case for investors. Since 2000, middle-market buyout (MMBO) funds have consistently outperformed their large-cap buyout (Large BO) peers, both at the median and upper quartile levels.
These performance differentials are driven by structural advantages that persist in the middle market:
- More Liquidity & Activity: Frequent entry and exit points.
- Lower Entry Valuations: Enhancing potential returns on invested capital.
- Fragmentation & Reduced Competition: Creating differentiated sourcing opportunities.
- Pricing Inefficiencies & Transparency Gaps: Allowing value creation through underwriting and engagement.
These dynamics allow investors a chance to access assets at more attractive valuations with greater upside potential—conditions that are increasingly rare in today’s efficiency-driven institutional markets.
Indexed Growth of $100K Investment (2000 – 2024) Using Median and Upper Quartile Net IRRs 3
Value Creation in a Liquidity-Constrained Market
Finding great companies isn’t enough. To produce returns, entry points matter.
As companies grow, having operational partners who can support areas like technology, finance, data analytics, talent management, and procurement helps build stronger, more resilient businesses.
When it’s time to exit, companies with $10 million to $250 million in revenue typically have more options than larger organizations that often rely on IPOs. Middle-market companies can acquire another business, be acquired by one with strong synergies, be sold to another strategic sponsor seeking to unlock further value or pursue a public offering.
Manager Selection: A Key Driver of Value Creation
Perhaps the most overlooked edge in the middle market lies in manager selection.
At GCM Grosvenor, we focus on emerging manager investing and maintain longstanding relationships with a broad network of middle market sponsors. We’ve been backing early-stage managers for over 20 years and believe it can lead to sustained outperformance and differentiated deal access. Over the last three years, 29% of our private equity commitments have been to small and emerging managers4. Many of those firms have since grown substantially in AUM and reputation.
Why does this matter? Because working with capacity-constrained and rising-star managers provides exposure to investment opportunities that are often unavailable through larger, more crowded platforms. It’s a form of access arbitrage—one that rewards conviction, relationships, and long-term alignment.
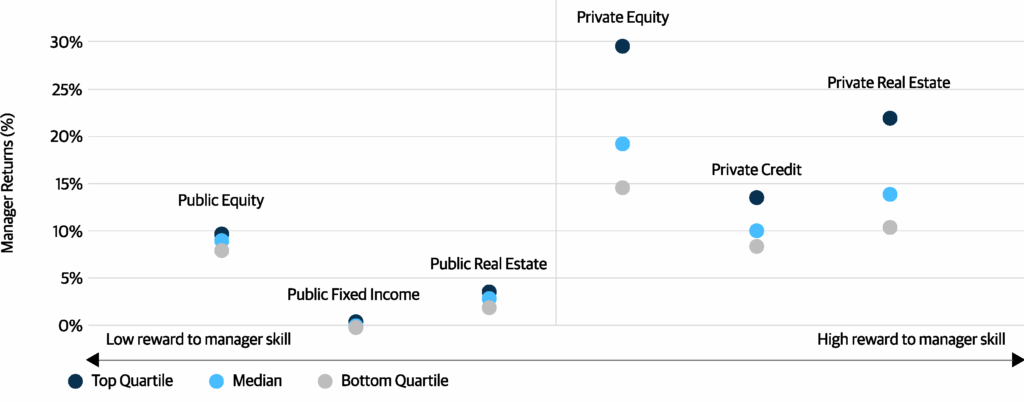
As shown in the chart to the right, private equity has historically delivered higher and more variable returns compared to public market asset classes—particularly in the middle market, where buyout funds (MMBO) have outperformed their large-cap peers (LBO) at the median and upper quartile levels. Because dispersion is greater in this sector, experienced partners like GCM Grosvenor are critical to ensuring this part of a portfolio is managed expertly and positioned to capture the potential upside while avoiding possible underperformers.
Dispersion of Outcomes, Manager Returns
Over a 5 Year Period5
Middle Market: Foundational, Timely, and Differentiated
The case for middle-market investing is both structural and timely. Today’s environment is amplifying long-standing advantages like flexibility, creativity, and informational asymmetry. Founders and family-owned businesses are seeking liquidity and trusted partners. Lenders remain constructive for high-quality borrowers. Larger sponsors are pursuing bolt-on acquisitions. Meanwhile, the secondaries market continues to unlock value from mature portfolios.
This convergence has created what we believe to be an especially opportune moment to lean into the middle market, particularly for investors who prioritize underwriting rigor, sourcing depth, and disciplined capital deployment.
In our view, the middle market is the foundation of the private equity ecosystem. In a world where dispersion is rising and capital must work harder, it’s where many of the best risk-adjusted opportunities take shape. For those willing to look beyond size and brand name, the middle market offers more than access—it can offer an edge.
1 Source: Pitchbook: Data as of October 9, 2024; represents North American and European Markets private companies with and without financial backing across all sectors. Revenue based on latest FY.
2 Source: Preqin: Dry powder available data as of October 14, 2024; Global buyout private equity funds with vintage years of 2010 through 2024.
3 Source: Burgiss: Data as of September 30, 2024. U.S. MMBO: Funds less than $3 billion; U.S. Large BO: Funds over $3 billion. Consists of 2000 – 2013 vintage funds
4 Source: GCM Grosvenor, Data as of September 30, 2024.
5 Source: Morningstar and Preqin. Public markets data represent open-end fund returns from 1/1/2017–12/31/2021: Public Equities (US Large Blend), Public Fixed Income (US Intermediate Core Bonds), and Public Real Estate (US Real Estate). Private markets data represent 2016 vintage closed-end funds with latest reported performance between 12/31/2020–9/30/2021: Private Equity (Buyout), Private Credit (All Private Debt strategies), and Private Real Estate (Co-invest, Core, Core+, Debt, Value-Added, Fund of Funds). Middle Market Buyout (MMBO) data sourced from Burgiss, as of 9/30/2024; includes U.S. buyout funds < $3B across 2000–2013 vintages.
Important Disclosures
For illustrative and discussion purposes only. No assurance can be given that any investment will achieve its objectives or avoid losses. The information and opinions expressed are as of the date set forth therein and may not be updated to reflect new information.
Investments in alternatives are speculative and involve substantial risk, including strategy risks, manager risks, market risks, and structural/ operational risks, and may result in the possible loss of your entire investment. The views expressed are for informational purposes only and are not intended to serve as a forecast, a guarantee of future results, investment recommendations, or an offer to buy or sell securities by GCM Grosvenor. All expressions of opinion are subject to change without notice in reaction to shifting market, economic, or political conditions. The investment strategies mentioned are not personalized to your financial circumstances or investment objectives, and differences in account size, the timing of transactions, and market conditions prevailing at the time of investment may lead to different results. Certain information included herein may have been provided by parties not affiliated with GCM Grosvenor. GCM Grosvenor has not independently verified such information and makes no representation or warranty as to its accuracy or completeness.